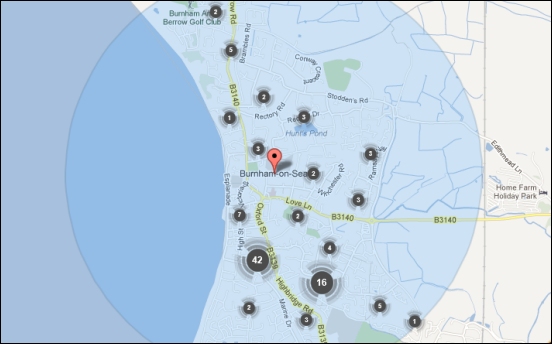
Residents in the Burnham-On-Sea area can now compare crime levels in their neighbourhood with other areas and see how recorded crime rates have changed over the past three years with a newly-expanded crime-mapping website.
Originally launched by the Home Office in 2011, the Police crime website here has been upgraded this week to show instances of offences such as robbery, burglary and violent crime, as well as anti-social behaviour (ASB).
The interactive mapping site allows users to browse crime and anti-social behaviour data on a street-by-street basis and the newly-expanded site also includes a tool which allows visitors to compare crime levels for a certain borough or district.
The site compares crime in users’ local areas with crime in other similar areas, such as those with similar demographics, economic and social characteristics.
To use the newly-updated site, type in a postcode or street name. Click the map on the right-hand-side of the page, under the header ‘Crime and outcomes in this area’, and to view the outcomes of these crimes, click ‘Outcomes’ on the left-hand-side of the page under ‘Activity in this area in’. To compare the recorded crime rate with other areas, scroll down below the map and select the link ‘Compare crime levels in your local area with other similar areas’.
Last week, Burnahm-On-Sea.com reported here that crime in the town had fallen 20 per cent year on year.


